
Ultimate Guide To Java Profilers: Which One is The Best?
Sometimes writing software that “just” runs is simply not enough.
Clients more often than not expect their product to run smoothly, even under significant loads. That’s why software performance is an increasingly important issue for programmers across the globe.
In today’s post, we are going to cover one of the most important tools for monitoring and troubleshooting performance issues in the Java ecosystem – profilers.
How do they work, and which one is currently the best? Keep reading to find out!
What are Java Profilers?
Java Profiling is the process of performing a thorough analysis of a software application to identify memory or performance-related issues. A Profiler is thus a tool that assists Java developers with optimizing and fine-tuning their java code.
Java profiling tools work at the JVM level and monitor Java bytecode. They help in monitoring tasks like Thread Execution, Objects creation, Execution of methods, and garbage collection. They track all the important java virtual machine details such as CPU usage, memory consumption, and garbage collection.
Taking that into consideration, Java profiler tools offer developers numerous advantages. Not only do they offer clear statistical insights for the development project, but also help in tracking down errors and bugs continuously.
Why is software performance important?
Some might wonder why it is even important to devote valuable resources to improving software application performance. Wouldn’t it be wiser to work on new functionalities instead?
Not really. In some business circumstances, performance is just as or even more important than software functionalities themselves. Whether software performance is important should be known right at the beginning of the development process.
Are you working on a rather small application for internal uses at a big corporation?
Performance shouldn’t be a big issue.
Are you developing a large e-commerce site or robust architecture for a financial company?
In this case, subpar software performance can become detrimental to the entire project. In some situations, even a fraction of a second of additional loading time can lead to thousands of dollars of potential revenues lost and a noticeably worse user experience.
Types of performance monitoring tools
When talking about monitoring Java performance, it’s also worth adding that Java profiler tools come in all shapes and sizes. They are designed with different tasks in mind and are characterized by various levels of interference in the code and the information they provide.
In custom software development, we can generally differentiate between three main categories of latency performance monitoring tools and profilers:
- Java virtual machine profilers – These are the most common types of profilers used for bytecode analysis. They allow for convenient memory usage control and performance bottleneck locating.
- Transaction Profilers – These Java profilers can be divided into two main categories: Aspect and Agent profilers. The first one is used to inject code into the start and end of the specified methods. The injected code can then start a timer and report the elapsed time when the method finishes. The latter uses Java Instrumentation API to inject code into the application. They have robust access to the application since the code is being rewritten at the bytecode level.
- APM Tools – These tools are used for monitoring applications in live production environments. APM tools show less amount of details than regular Java profilers, but present developers with the most important information relevant to regular performance maintenance.
[Read also: How to Choose a Software Development Company – CHECKLIST]
Java performance statistics
Java stands out for its speed, ranking second in the Benchmarks Game for average execution time, only behind C#. It excels in sorting and string tasks.
In a GitHub study, Java comes third in calculating pi, showing strength in file handling. However, in a multi-threaded web crawler simulation, Java places fourth after Go and Python, still performing well in downloading and data processing. This indicates Java’s robust performance across a variety of tasks.
What do these statistics tell us?
Java is a greal all around programming language, not excelling in any particullal field, but being good enpough in all of them – a perfect combination for robust enterprise grade software solutions.

Top 6 Java profiling tools
One of the most important aspects of profiling is the fact that it is not a one-time task, but a continuous process. This really underscores the need for choosing the correct Java profilers at the beginning of the development process. The right choice can help conduct all the essential performance monitoring tasks to avoid any issues that could lead to potential bottlenecks and other problems down the line.
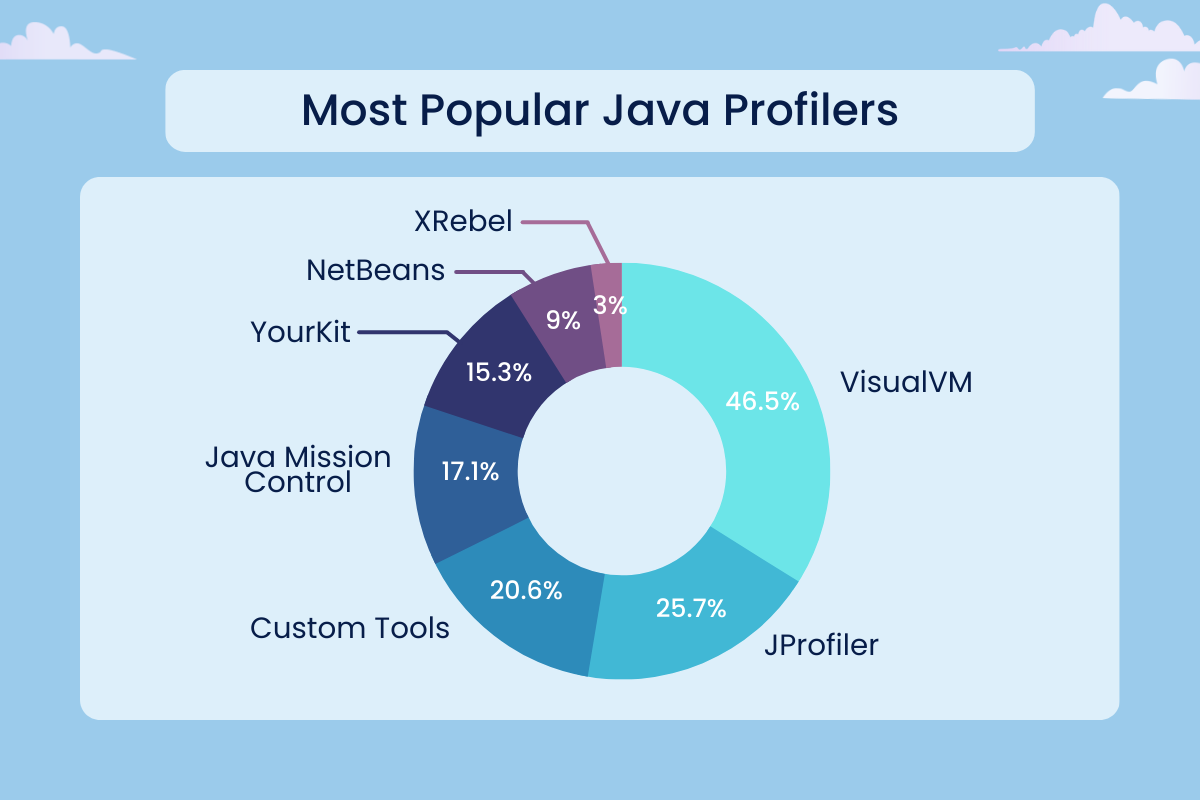
Here is the list of the six most popular Java profiling tools with their pros, cons, and some notable features, so that you can decide which one is the best suited to your needs.
1. JProfiler
JProfiler is one of the most popular, professional tools for analyzing what is going on inside a running JVM.
JProfiler is a top choice for many developers. With an intuitive UI, this Java profiler provides interfaces for performance and memory snapshots, and thread profiling for both local and remote applications.
With this information, programmers know what parts of the code need further optimizations, elimination, or changes. Jprofiler stands out from the crowd thanks to the extensive package of tools most valued by developers worldwide. This product requires purchasing a license, but also offers a free trial.
Pros
- JProfiler has almost all the features in VisualVM (controlling system performance, memory profiling, expected memory leak fix, and thread profiling),
- Intuitive and user-friendly UI,
- Live session debugging,
- Simple integration process requiring no code, xmls, or lengthy configuration.
Cons
- Paid version is expensive,
- Takes a lot of resources to run,
- Running an application and Jprofiler on the same machine significantly hinders server performance.
[Read also: Java Best Practices That Every Java Developer Should Know]

2. Java VisualVM
Java VisualVM is a simplified, open-source profiling tool for Java applications that has taken a top spot when it comes to popularity among developers.
By default, it came bundled with the Java Development Kit up to JDK 8, but was removed in JDK 9 and is now distributed as a standalone tool.
One major advantage of this Java profiling tool is that developers can extend its functionalities by developing bespoke plugins. These plugins can later be added to the built-in update center.

Pros
- Free, open-source solution,
- Most popular among Java developers,
- It Displays Local as well as Remote Java Processes,
- Allows for further modifications using custom-made plugins.
Cons
- Doesn’t have more advanced functionalities,
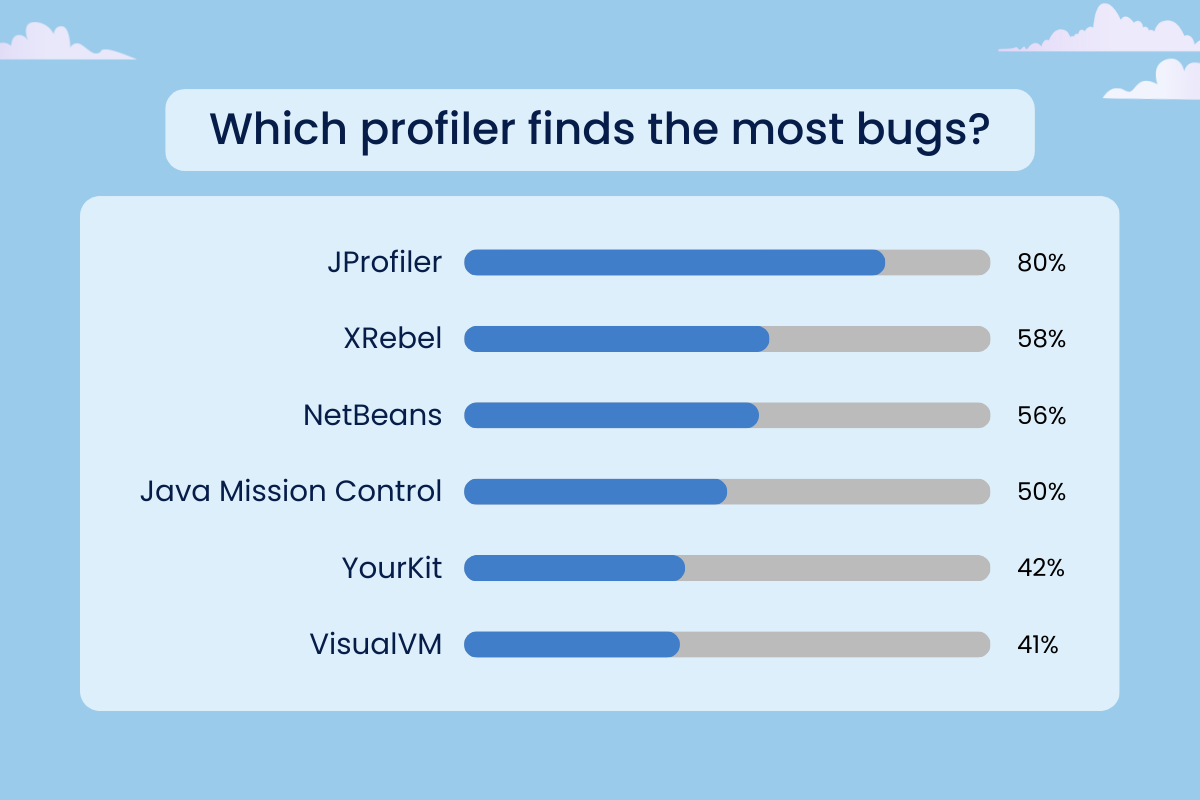
- It lags behind the competition in terms of finding bugs in code.
[Read also: Why Is Java So Popular?]
3. NetBeans Profiler
The NetBeans custom Java profiler is bundled with Oracle’s open-source NetBeans IDE.
When it comes to the functionalities, it offers very similar functionalities to Java VisualVM. It provides popular profiling features such as CPU profiling, memory, Sql queries, and threads profiling. It also supports JVM monitoring functionalities that are helpful in solving performance issues. This Java interactive profiler is a great choice when looking for a complete open-source development tool package (IDE + Profiler).
Pros
- Bundled with open-source NetBeans IDE,
- Works with multiple platforms,
- Good choice for lightweight development and profiling,
Cool features:
- unique feature of knowing how often garbage collection occurs
4. XRebel Java profiler
The XRebel is Java Profiler is a very lightweight Java Profiler tool by Perforce – creators of the JRebel productivity tool.
XRebel is a profiler that enables checking of the application’s performance from one end to another – even in distributed applications. When combined with real-time Java performance metrics, CPU, and memory snapshots, this is an interesting choice for Java developers.
Pros
- Very nimble and lightweight,
- Saves time thanks to skipping the redeployment process.
Cool features
- Provides real-time feedback on an application’s performance,
- Root Cause Analysis,
- Full Transaction Diagnostics and notifications.
5. YourKit Java Profiler
YourKit Java Profiler is yet another popular Java profiling tool that runs on many different platforms and operating systems such as Linux, Windows, MacOS, Solaris, FreeBSD, etc.
Yourkit Java profiler also provides several features such as thread visualization, garbage collection, memory leaks, and memory usage control. It also supports local and remote profiling for using ssh tunneling.

Pros
- One of the top (paid) choices for many Java developers,
- Easy integration process with popular IDEs,
- Comprises popular core features like telemetry and performance charts, thread visualization, memory usage, and memory leaks control,
- It provides support for local and remote profiling via ssh tunneling.
Cool features:
- Advanced CPU profiling feature that allows for focusing profiling on certain areas of the code, such as methods or subtrees in threads,
- Conditional profiling through its what-if feature,
- Cool features for Java data science such as Profile SQL, and NoSQL database calls.
6. IntelliJ Profiler
Last, but not least, we come to the IntelliJ Java profiler.
It is a simple, yet powerful tool for memory and CPU profiling, and as the name suggests – it is bundled with InteliJ IDEA IDE.
It combines the functionalities of two powerful Java profilers: Java Flight Recorder and Async profiler. Programmers using the built-in IntelliJ tool can choose between these two profiling options.
Pros
- Easy to use,
- Combines power of the CPU and Allocation profilers,
- Great results visualization options.
Cons
- Bundled with paid IDE,
- Resource demanding.
Time to start your journey with profiling!
Java profilers are the backbone of software performance monitoring and maintenance.
As we’ve shown in this article, Java developers have a wide range of different profiling tools at their disposal, each offering different functionalities best suited for specific business scenarios.
Choosing the right profiling tool for the job is now more important than ever, as, in many software systems, each fraction of a second a developer can shed from loading time can be extremely precious to the business itself.
Related Posts
Thank you for taking the time to read our blog post!