
Top 5 Java Performance Problems and How to Solve Them
Even after almost 30 years on the market, Java is still the choice of companies around the globe for the development of software applications where performance and latency are the uppermost priority.
Even though there are more “cool” alternatives on the market, such as Golang and Rust, Java is still praised by developers for its versatility and relative ease of use.
However, developing high-performance software is not easy. There are many traps and pitfalls that Java developers need to be aware of.
In this article, we’ll explore the top 5 performance issues that Java developers commonly face, and provide tips and best practices for solving them. Whether you’re new to Java development or a seasoned pro, this article will help you identify and resolve performance issues in your Java applications.
Contents
- Why software performance matters?
- What is performance tuning in Java
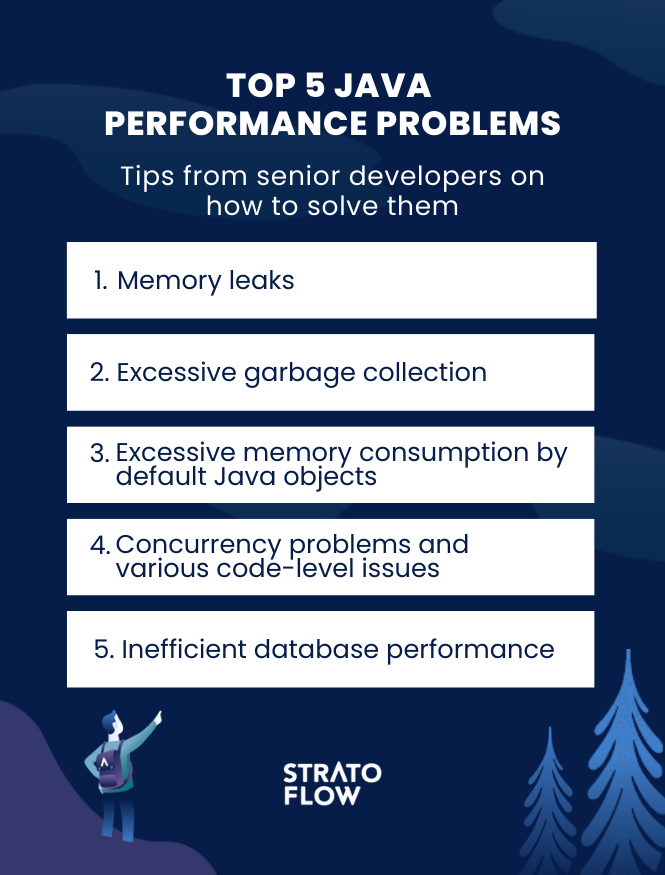
- The 5 most common Java performance problems and how to solve them
- 1. Memory leaks and out-of-memory errors
- 2. Excessive garbage collection
- 3. Excessive memory consumption by default Java objects
- 4. Concurrency problems and various code-level issues
- 5. Inefficient database performance
Why software performance matters?
Let’s start by answering the critical question: why does it matter? Why are Java application latency and software performance important?
In today’s fast-paced world, users demand software that delivers fast results and responds quickly to their inputs. Even a fraction of a second can mean thousands of dollars in lost revenue and an increased user bounce rate. It is therefore critical to ensure that software performance is optimized to meet these high expectations.
A poorly performing software application can lead to frustration, reduced productivity, and user satisfaction, ultimately resulting in lost business opportunities. As a result, developers must prioritize software performance and continually work towards improving it to deliver a seamless user experience.

What is performance tuning in Java
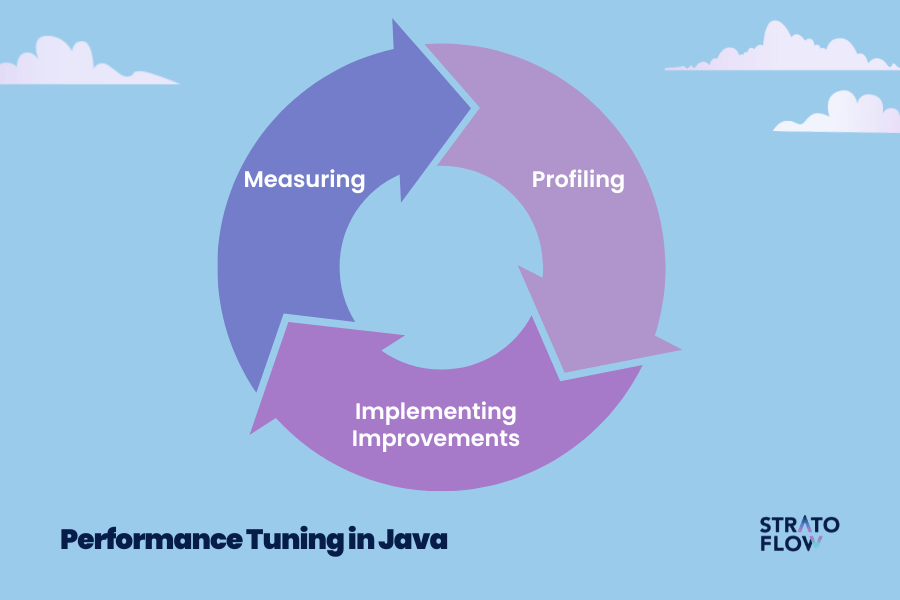
Performance tuning in Java is a set of activities aimed at optimizing the performance of Java applications. This includes identifying performance bottlenecks and implementing changes to improve overall application performance, latency, and throughput. Here are three key aspects of performance tuning in Java:
- Measuring performance – Performance tuning is an ongoing process. It’s imperative to measure the performance of the application before and after implementing performance enhancements to ensure that the changes have had the desired effect. A great practice is to include performance testing in your standard CI/CD pipeline, so that the current performance metrics can be tracked against any changes made to the source code.
- Profiling and identification of performance bottlenecks – Profiling is an integral part of Java performance tuning. Java profilers are great tools for identifying the areas of the application that are causing performance degradation. These tools can provide detailed information on memory usage, CPU usage, and thread activity. Once performance issues have been identified, Java developers can determine the root cause of the problem and act accordingly. This could include issues such as inefficient algorithms and logic, excessive I/O operations, or poorly optimized database queries.
- Implementation of performance improvements – Once the performance bottlenecks have been identified, developers can implement changes designed to improve Java applications’ performance.
[Read also: Why use Java for Data Science?]
Java performance statistics
Java, even after 30 years on the market still excels when it comes to performance it offers, ranking second in the Benchmarks Game for average execution time, only behind C#.
It is great for all sorts of sorting and string tasks. In a GitHub study, for calculating pi, Java comes in third, showing strength in file handling. In a multi-threaded web crawler simulation, Java places fourth after Go and Python, still performing remarkably well in downloading and data processing. This indicates Java’s robust performance across a variety of tasks.
What do these statistics tell us?
Java is a greal all around programming language, providing good enough performance, solid community base and rich array of resources and frameworks – a perfect combination for robust enterprise grade software solutions.

The 5 most common Java performance problems and how to solve them
1. Memory leaks and out-of-memory errors
Problem
Memory leaks are considered to be one of the most common Java performance issues In reality, however, a memory leak is a problem directly related to the application itself.
In Java, memory leaks occur when a program doesn’t release memory that it no longer needs. This means that objects in the program’s memory are not properly freed, causing the program to gradually consume more and more memory. In Java this usually means, that there are references to unused objects, as JVM uses Garbage collector for memory management. If the memory usage continues to grow without proper deallocation, the program’s performance could be severely degraded, or in the worst case, it might crash altogether, resulting in an OutOfMemoryError.
An OutOfMemoryError is thrown when the Java Virtual Machine (JVM) runs out of memory. When such an error occurs, the program will usually crash or become unresponsive.
Severity
8/10
Solution
Software developers don’t have direct control over program memory, but as always, it is best to be proactive rather than reactive.
The remedy, in the case of memory leaks, is fairly straightforward – developers should only use proven, well-known, coding practices as well as stable libraries and frameworks, as these are, in fact, the main culprits that cause memory leaks.
However, if a memory leak does occur, the first step is to identify its source. Profiling helps you understand how much memory your code is using, how much memory is allocated for each object, and how long each object lives in memory. You can use Java profiling tools such as Java VisualVM or Eclipse Memory Analyzer to identify which objects are causing the most performance problems.
Other tips include using weak references, which allow objects to be garbage collected even if they are still referenced elsewhere in the code. Make sure you only use them for caches or other temporary objects that can be easily recreated if necessary. When it comes to the garbage collector, there is also some fine-tuning that can be done based on your application’s memory requirements. Finally, there’s monitoring. Use memory monitoring tools to keep a constant eye on memory usage and act accordingly.
It is also worth noting that if you are experiencing out-of-memory errors and are sure that they are not caused by memory leaks, you can always increase the memory allocation for the JVM by using the -Xmx option. This will increase the maximum heap size that the JVM can use, but as with many other things related to memory, it is a matter of finding a golden mean.
2. Excessive garbage collection
Problem
Problems with the garbage collection process are one of the most common performance issues in Java applications.
As a reminder, the garbage collection process is responsible for memory management within Java programs. It automatically allocates and deallocates memory in a Java program. Basically, it identifies and removes objects in memory that are no longer used by the program, freeing up space for new objects to be created.
The garbage collector is usually an incredibly helpful tool, but frequent occurrences of this process can also impact performance. When the garbage collector is full, it can cause the application to slow down. It can also sometimes pause all threads attempting to access JVM resources to reclaim memory.
In systems where real-time computing and stable, low latency are critical, this might be a real concern.
The general rule of thumb is that for optimal Java software performance, a garbage collector should consume less than 10% of CPU cycles. If a garbage collection process consumes more than 20% of the CPU, the application will have significant performance problems related to memory.
Severity
8/10
Solution
Because garbage collectors can degrade performance, you may be tempted to minimize their impact, but this requires a little more advanced programming knowledge.
First and foremost, you should always choose a garbage collector that is best suited to your individual project. The most common GC algorithms are Serial, Parallel, CMS, G1, and ZGC. If your application requires a highly scalable, low-latency garbage collector, you should consider using the ZGC. It performs all time-consuming work concurrently, without stopping the execution of app threads for more than 10 ms. If your application is primarily concerned with performance and low latency, you are better off using the concurrent garbage collector. On the other hand, if your application prefers shorter garbage collection pauses and can afford to share valuable processor resources with the garbage collector while the application is running, you should consider CMS. If you can live with your application freezing while the GC is running, you can choose parallel and serial GC.
Another performance tuning measure should be to adjust the heap size. In a nutshell, the heap size is the amount of memory allocated to the Java Virtual Machine (JVM) for object allocation. The larger the heap size, the less frequent garbage collections will be. The downside is that it increases the time it takes for each garbage collection process to complete. An experienced software developer will be able to adjust the heap size to balance memory allocation and garbage collection.
Finally, you can also use Java tuning flags. These allow developers to customize the behavior of the garbage collector. Some of the most common tuning flags are -XX:MaxHeapFreeRatio, -XX:MinHeapFreeRatio, -XX:NewSize and -XX:MaxNewSize.
3. Excessive memory consumption by default Java objects
Problem
Java’s object-oriented nature makes it a powerful and flexible programming language, well suited to a wide range of complex applications.
But there’s another side to this coin. It turns out that, by default, Java takes up a significant amount of system memory and devotes it to its objects.
This can be detrimental to the performance of the application if no precautions are taken.
Firstly, it can significantly slow down the application, as more memory usage directly translates into more garbage collector work, more time spent creating objects, and more time dedicated to allocating and freeing memory. In addition, the processing speed is visibly slower.
Secondly, for applications that require a lot of data in memory, it is more difficult to process them on a single machine, and then you have to scale out your system horizontally, which also affects performance.
Severity
9/10
Solution
First and foremost, to minimize excessive memory consumption by default Java objects, developers should have a thorough understanding of the data structures that are in use in the development project.
Developers can also optimize the JVM to reduce memory consumption. Consider using off-heap memory (not managed by the garbage collector) – a brand-new memory API just released in the latest version of Java that allows you to manage memory more directly. But be careful! Such an approach carries additional risks because you are messing with memory by yourself. It’s much easier to accidentally screw something up and create unintentional memory leaks (it seems that the garbage collector is quite a useful beast after all).
There are also some simpler tips for saving memory on Java objects. First of all, avoid creating unnecessary objects that can lead to uncontrolled memory bloat. For example, you can use string literals instead of creating a new string object each time. You can also look at the Flyweight pattern. This is a structural design pattern that allows programs to support large numbers of similar objects and keep their memory consumption low by sharing them. Also consider using primitive data types such as int, boolean, and char, which use less memory than their corresponding object counterparts such as integer, boolean, and character.
4. Concurrency problems and various code-level issues
Problem
Concurrency problems and code-level issues are not Java problems per se, but rather mistakes made by inattentive developers. Nevertheless, they deserve a place on our list as they are one of the factors that contribute to performance bottlenecks.
Code-level problems are caused by errors in code constructs, such as poor iteration, inefficient application code algorithms, improper use of generic templates, and inefficient code that causes time complexity.
Concurrency problems, on the other hand, typically occur when multiple threads attempt to access and modify shared resources simultaneously. These problems can lead to deadlocks, gridlocks, and other synchronization issues that can cause the program to behave unpredictably or even crash altogether.
Because it is so easy to create synchronised blocks, developers sometimes tend to create synchronised blocks without understanding the performance implications. When hundreds of threads synchronise on the same lock, the Java application’s processing of requests is severely slowed. This problem is commonly known as thread gridlock, and when it occurs in production, it is very difficult to determine which lock is the main culprit.
Another common synchronization issue is thread deadlocks. A deadlock is a situation where two or more threads are blocked waiting for each other to release resources they need to continue. For example, thread A, which has an object lock, is waiting for thread B to execute, while thread B has a lock of its own and is waiting for thread A to execute. Now, these two threads are deadlocked and will never execute, causing the application to hang or crash. Again, this problem is caused by developer error rather than Java design.
Severity
6/10
Solution
Most common code-level problems can be avoided to some extent by applying best practices during application development. Just make sure you and your team follow code optimization practices and write high-quality, clean code. The problems that occur post-development can also be easily isolated using application performance monitoring (APM) solutions. For example, APM Insight can isolate many code-level issues in Java applications in development, QA and production environments.
When it comes to concurrency issues, the story is pretty much the same. The best way to avoid them is to educate yourself and other team members on best coding practices. Make your program and its resources as immutable as possible, use synchronization safely, and check for potentially dangerous thread interactions.

You should also look at the Java data structures, as many of them are not thread-safe. They were not designed with multithreading in mind. So, to avoid concurrency problems, use thread-safe data structures such as ConcurrentHashMap and CopyOnWriteArrayList. You should also look at executor frameworks and thread pools, both of which are powerful tools for managing threads in Java. Thread pools limit the number of threads that are created, which, in turn, reduces the risk of gridlocks and deadlocks. Executors, on the other hand, can help you manage thread pools themselves by assigning tasks to specific threads and monitoring the progress of concurrent operations.
5. Inefficient database performance
Problem
Last but not least, we should talk about databases and interactions with external systems.
The database server is an absolutely critical component of every Java application. A bottleneck in the databaseserver or problems with connections would have a direct impact on core functionality, application performance and end-user experience.
Firstly, let’s cover database connections. Because it is expensive to open new connections for every data request, developers use pool connections for ordinary data transfers. When the number of connections reaches the limit, new requests have to be put on hold until existing database requests are completed. Note that if a connection is derived from a particular pool and isn’t later released back into the pool, this will lead to connection pool leaks, which can then cause application errors.
High connection pool usage can also occur if the database server has significantly slowed down its processing. It is therefore important to know which performance problems are caused by database connection leaks and which are caused by a common database server bottleneck.

There is also the issue of caching. Caching involves storing frequently accessed data in memory, where it can be quickly accessed by the application without having to query a database each time it is needed. But if caching is neglected, problems can arise. Without caching, there can be serious performance issues as all resources will have to be fetched from the database each time they are needed. There is also a massive difference in latency of operations accessing data from CPU cache memory, RAM memory, network or a hard drive, see more: Latency numbers every Java developer should know.
There’s also the issue of configuration, as improper caching settings can also be problematic. Cached Java objects are stateful in nature, unlike pools, which contain only stateless objects. If caching is not configured properly, a recently used object may be removed from the cache to make room for a new object, resulting in a “cache miss” scenario when that object is needed again.
Severity
7/10
Solution
When it comes to the servers themselves, the simplest tip should be to use application performance monitoring tools to monitor the end-to-end health, availability, and performance of Java application servers. Track key application server metrics to understand anomalies and anti-patterns. Since poorly optimized database queries can significantly impact server performance, ensure that queries are written efficiently using an object-relational mapping (ORM) framework such as Hibernate.
For pool connections, it is important that developers and DBAs have a good understanding of the application workload and configure it accordingly. Monitor all key pool metrics such as allocated, free, and managed. Also monitor Java performance metrics related to other connections to the database, such as total connection time, active connections, and database server health. This can help you identify the cause of connection leaks.
When it comes to caching, it’s important to choose carefully what data to cache, as caching too much data can result in unnecessary memory usage, while caching too little data can result in reduced performance gains.
You should also choose a caching framework that meets your specific needs, such as data expiration, eviction policies, and distributed caching. The most popular options on the market today are Ehcache, Hazelcast, and Redis. You can also use caching patterns such as read-through, write-through, and cache-aside to simplify caching implementation and reduce the risk of cache inconsistencies.
Finally, remember that to achieve the best possible Java performance, cache tuning should be done in conjunction with other optimization techniques, such as query and code optimization as well as database tuning.

Most common Java performance problems – closing thoughts
Java development is still a very popular way to build software with low latency and high performance in mind.
However, developers need to be careful.
There are still many places where seemingly unnoticeable mistakes can have serious performance implications. It is therefore crucial to be aware of the most common performance issues and ways to avoid them.
Related Posts
We are Stratoflow, a custom software development company. We firmly believe that software craftsmanship, collaboration and effective communication is key in delivering complex software projects. This allows us to build advanced high-performance Java applications capable of processing vast amounts of data in a short time. We also provide our clients with an option to outsource and hire Java developers to extend their teams with experienced professionals. As a result, our Java software development services contribute to our clients’ business growth. We specialize in travel software, ecommerce software, and fintech software development.