
11 Most Important Website Performance Metrics
No matter whether you are looking to improve conversion rates in your online store or to increase the number of users on your SaaS application, the first place you should look into is website loading speed.
Where to start when it comes to website performance optimization? The best first step is getting familiar with all the different types of website performance metrics. It can give you an objective insight on whether your site is loading properly, and what to do to improve it.
In this article, we are going to cover the most important tools that allow you to measure the performance of your website or application, and some tips to improve it.
Contents
- What is website performance?
- What is page speed?
- How to measure website performance?
- Why does website performance matter?
- 11 website performance metrics:
- 1.Time to first byte
- 2. Speed index
- 3. Time to last byte
- 4. Time to Start Render
- 5. DNS Lookup Time
- 6. Hardware utilization
- 7. Overall weight
- 8. Asset weight and count
- 9. Largest Contentful Paint (LCP)
- 10. First Input Delay (FID)
- 11.Cumulative Layout Shift (CLS)
- What metrics are important to your SaaS website performance
- Ecommerce website performance metrics
Internet speeds across the world have increased substantially in the past years as broadband fiber optic Internet has become available even in smaller towns and communities. In fact, in 2008, only 16% of Americans had access to Internet service of 10 Mbps. Today, this figure is 95%, and speeds in excess of 1 gigabit are becoming normal as technologies like 5G are becoming more prevalent.
But what does it have to do with website performance?
In the good old days of dial-up modems, people were used to waiting for a page to load. Nowadays, unnecessary delays are unacceptable and only a couple of seconds of waiting can easily lose millions of dollars in potential sales as well as quickly discourage visitors.
There’s no easy way around this problem – if you are not taking care of your site performance, you are hurting your business in a big way.
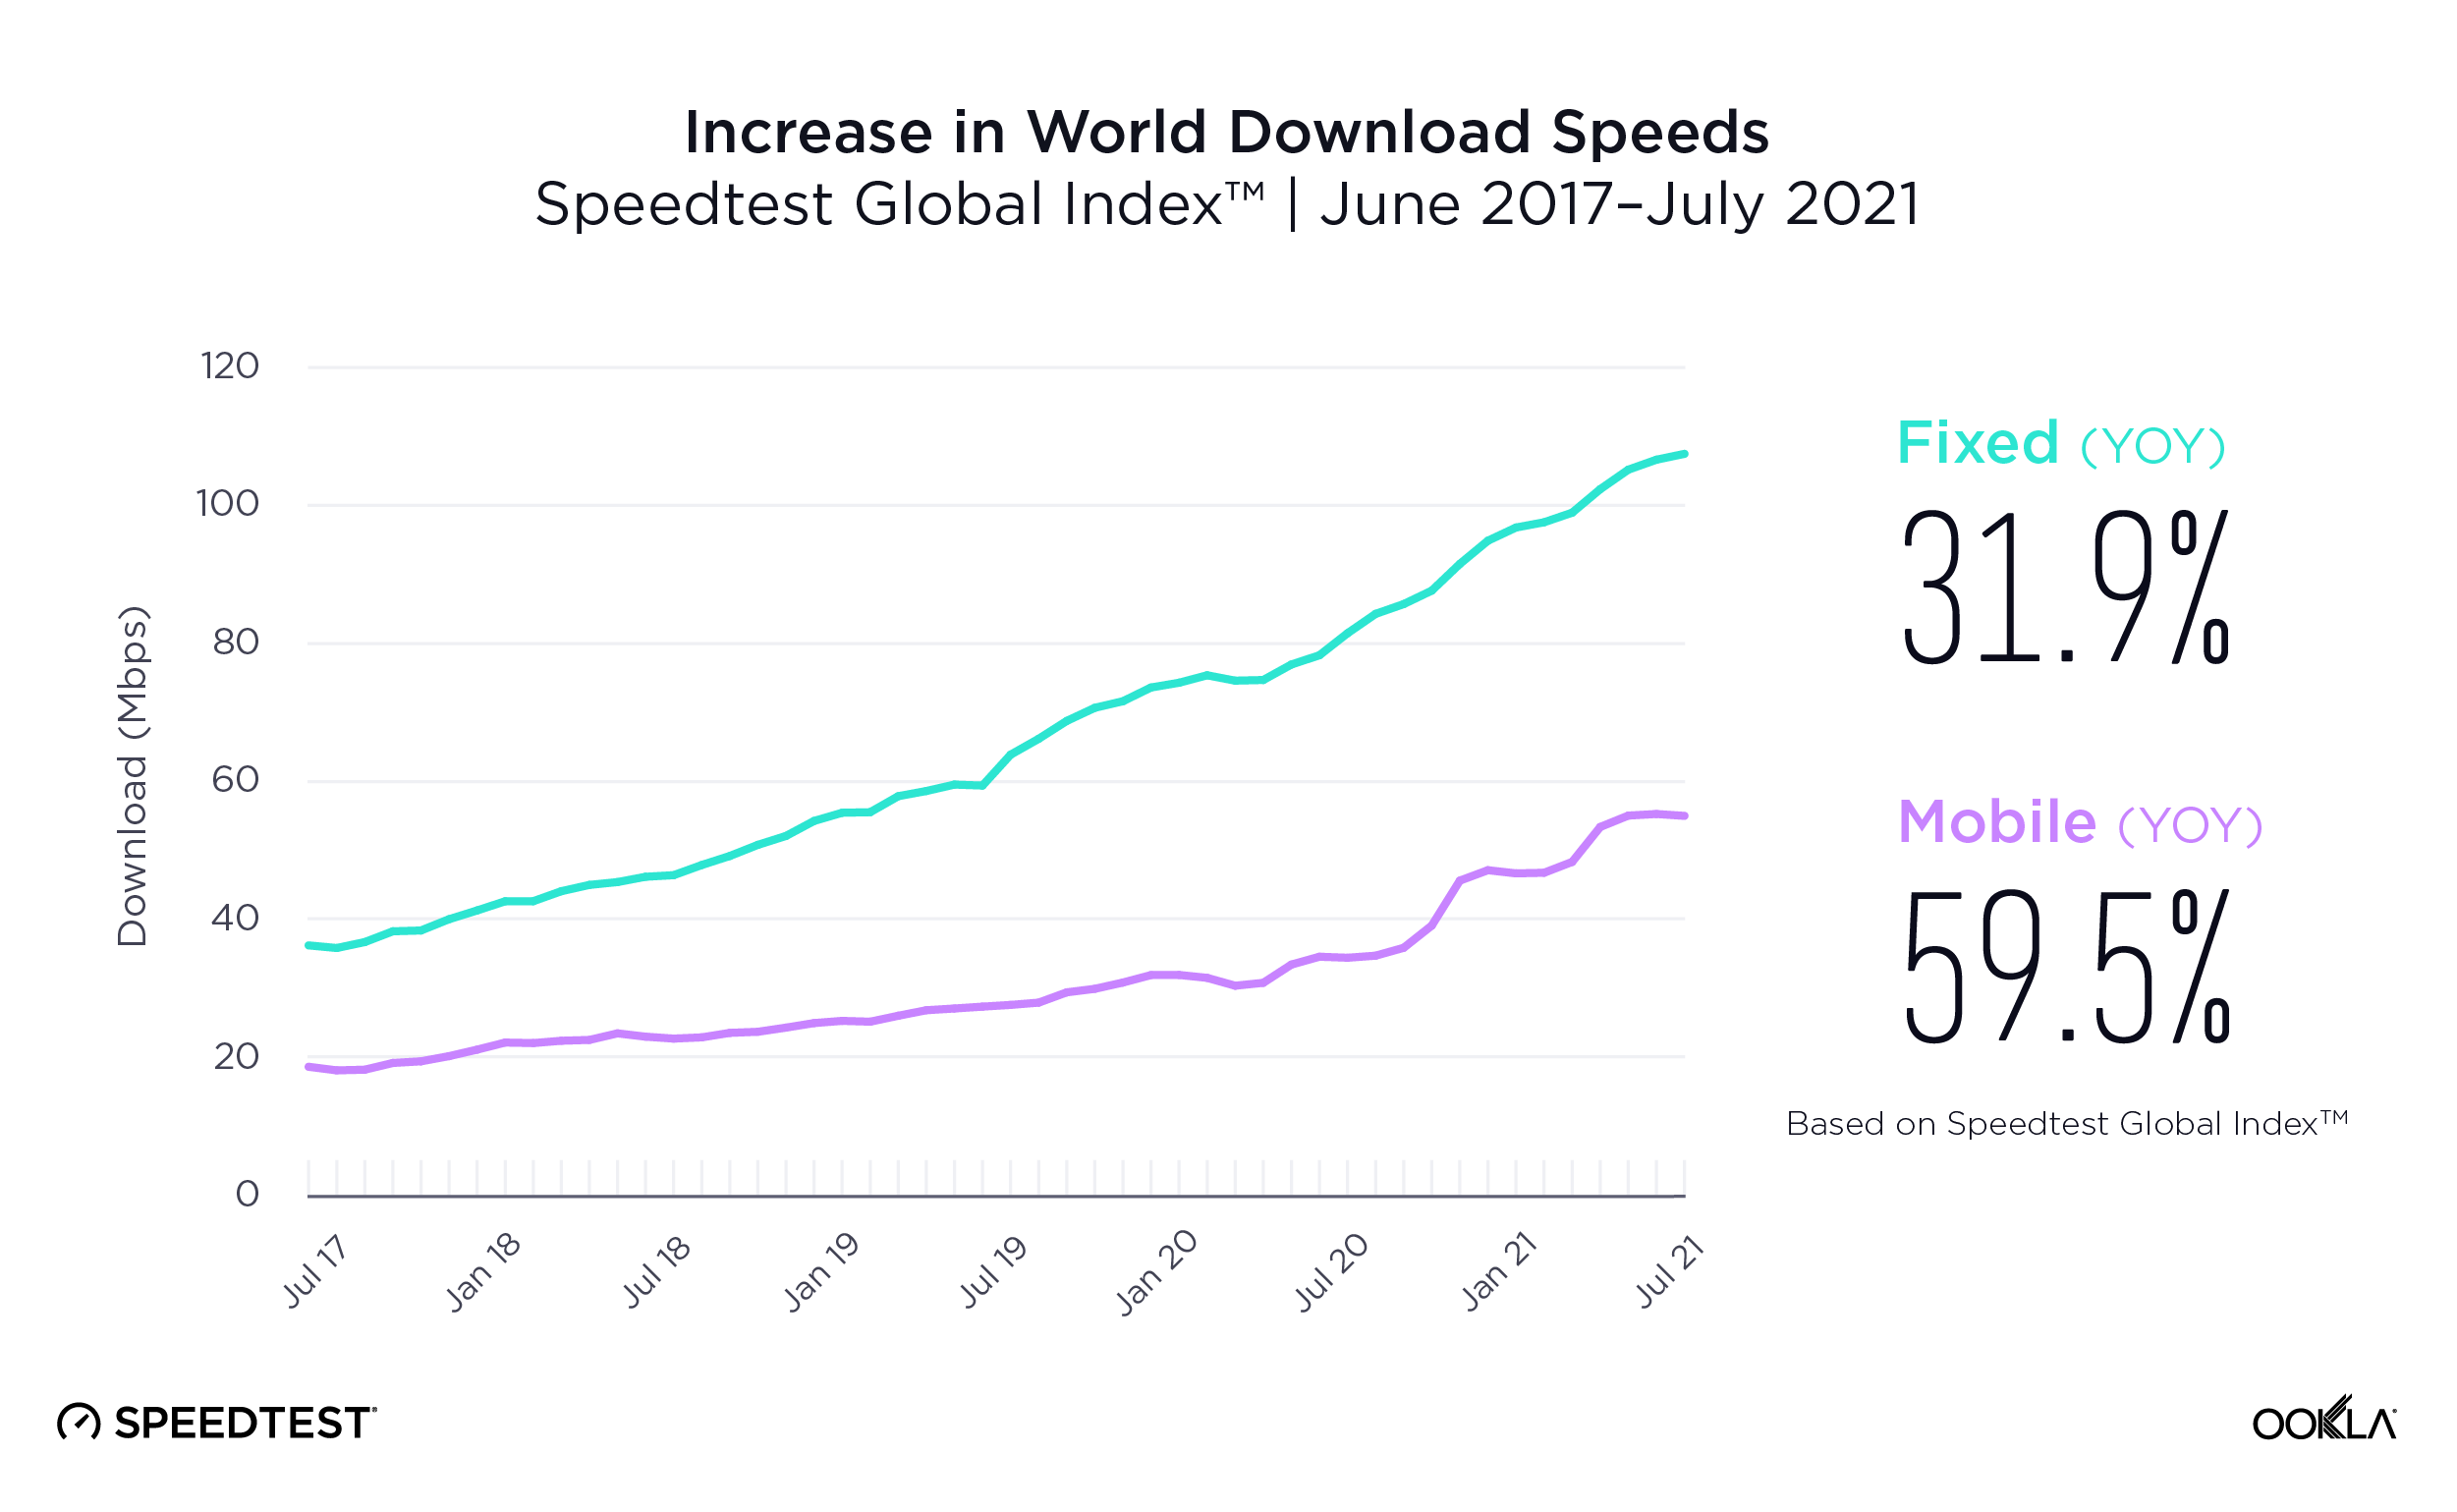
Source: Speedtest
What is website performance?
Web performance is a concept encompassing all the different approaches and optimizations in making websites fast, including making slow processes seem fast. It is directly related to Web performance optimization (WPO) which is a process of making the online user experience as smooth as it can be.
It is worth mentioning that there is a clear difference between server performance and website performance, and these terms are not interchangeable. Server performance measures the response time of a given HTTP request. Website performance on the other hand is how much time it takes for a website to load on the end user’s browser.
What is page speed?
Page speed, or website load time, refers to the time it takes for a website to load all of its elements onto the end user’s screen. This includes text and interactive buttons, as well as images, and videos. Ultimately, page speed refers to the entire time, from sending HTTP requests to a server, all the way to displaying the last elements of a given website.
Simply put, page speed is a measure of how fast all content loads for its end users.
The site’s performance is now more important than ever. In a recent survey conducted by Unbounce, nearly 70% of online shoppers think that page speed is one of the key factors influencing their shopping decisions online.
How to measure website performance?
There are numerous ways to measure the performance of a given website and each focuses on a different aspect of this term.
There are various speed test sites, as well as load testing tools, which provide admins and developers with valuable insights into which aspects of a site need extra attention and further improvements. The most popular tools include:
- Google PageSpeed Insights monitoring tool
- WebPageTest
- Sematext
- GTmetrix
Each of them measures different performance metrics.
We can differentiate 3 distinctive groups of key performance indicators:
- Classic technical performance metrics,
- Metrics related to the content characteristics,
- User-based performance metrics.

Why does website performance matter?
The importance of website performance in today’s digital world is undeniable. From effects on UX to real impact on bounce rate as well as other KPIs – a faster website can improve all of these aspects of doing business online.
Experts have determined that a seemingly unnoticeable 100ms decrease in homepage load speed has led to a 1.11% increase in session-based conversion, resulting in an annual revenue increase of nearly $380,000. What’s more, a similar decrease in the checkout page was responsible for a 1.55% increase in the session-based conversion rate.
Website performance has without a doubt a large and measurable effect on almost all key performance metrics. An E-commerce business specializing in delivering frozen meals after reducing average page loading time by 850 milliseconds increased its conversions by 7% and decreased bounce rates by 7%. Simply put, the quicker a webpage loads, the more likely a user is to perform the targeted action on that webpage.
So, how fast is fast enough for good experience?
This is a tough question as there’s no clear and definitive benchmark for website performance. In 2010 Google stated that a web page must load fully within two seconds for a positive user experience. This value is still often referenced to even a decade later.
11 WEBSITE PERFORMANCE METRICS
Measuring the website performance isn’t as simple as getting feedback from customers about how pleasant their online experience with your company ha been.
Such opinions are neither objective nor easily measurable. To get true insights into how well your webpage is performing, you will need to use performance metrics.
Below, we’ve listed 11 most important ones in 3 different categories: Key, Content Characteristics, and User-centric performance metrics.
We also pointed some tips on how to improve the results in some of them.
Read also: How to Choose a Software Development Company in 2022 [CHECKLIST]
Key Performance Metrics
1.Time to first byte
The metric that probably most often appears in different tools measuring website performance is Time to first byte or TTFB for short.
This metric is essentially the amount of time it takes for receiving its first byte of data from the web server after site visitors make their HTTP requests.
HTTP requests are simple inquiries that are made to the servers. Keep in mind that each request needs to have a dedicated response and each server can handle only so many concurrent requests. Therefore, a very large number of HTTP requests can result in poor performance and slower user input.
Time to first byte is one of the key website performance metrics, since the faster the TTFB, the faster the requested content is delivered to the end user’s browser.
Technically speaking, TTFB consists of the sum of the following request phases:
- Redirect time,
- DNS lookup speed,
- Connection time as well as TLS negotiation,
- Request, until the arrival of the first byte of the response.
Determining the optimal value of the TTFB metric can be quite challenging since it can vary greatly depending on what sort of content your website is displaying as well as your server’s configuration. However, taking web averages into consideration, a TTFB value under 100 ms is considered to be a superb result.
Values in the ballpark of 300 ms are standard among modern websites, and these between 500 ms and 1 second leave some room for improvements. Everything above 1 second should be thoroughly looked into as it certainly hurts the business.
Dividing the websites by the content they display, the average TTFB values are as follows:
- Dynamic content – 200ms-500ms
- Static content – Under 100 ms
Are your values noticeably higher than the industry average? Here are some of the most common factors negatively influencing TTFB:
- The abundance of dynamic content,
- Problems with networking and web server configuration,
- Server data capacity and throughput issues (high RAM latency, network bottlenecks),
- Inadequate and inefficient database design.
Read also: Benefits of Digital Transformation
2. Speed index
The Speed Index (SI) is another very important metric.
It is a synthetic timing measure that is computed using visual differences between frames captured during the page loading process. Each visual frame during the entire loading process is captured and later scored in terms of visual completeness – time until all content is visually complete on the web page.
Speed index (SI) is a more user-centric metric as it will let you know if the visible content is loading quickly or not. The lower the score, the better the user experience.
In order to maintain a good score, there are two crucial aspects worth paying attention to:
- optimizing content efficiency,
- optimizing rendering path.
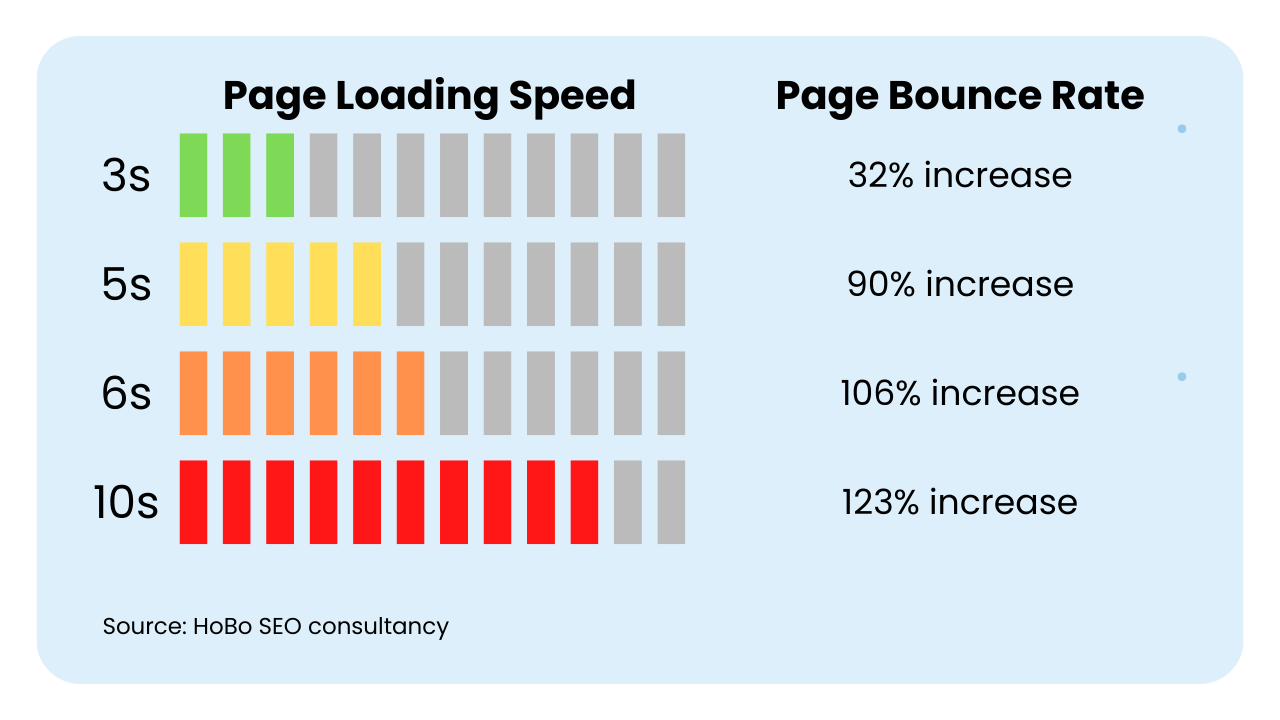
By optimizing displayed content using progressive rendering, you can greatly improve user experience as people will right away see assets appearing on the screen instead of waiting for a complete webpage to load.
It is worth mentioning though that Progressive rendering has to take into consideration the Cumulative Layout Shift (CLS) metric, which we will cover in detail further in this article.
Different applications can measure Speed Index a bit differently using various units, although advisable SI thresholds can be divided as follows:
- Perfect Score – 1311 milliseconds or less,
- Average Score = 1311 to milliseconds,
- Room for improvements = 1711 to 2300 milliseconds,
- Much longer than recommended = higher than 2300 milliseconds.
In order to achieve faster and smoother visual completeness of the site, web developers can use such optimization strategies like:
- Minimizing load on the main thread,
- Reducing JavaScript execution time and removing unused code,
- Reducing the influence of third-party code and plugins,
- Changing large JavaScript libraries to their smaller counterparts.
3. Time to last byte
Analogically to the TTFB, when the user’s browser finally receives all the data, the last byte time is recorded.
The Time to Last Byte, or TTLB, is defined as a delay between the request sent by the browser and receiving the last byte of the related response. The Time to Last Byte represents the time it requires to download all the necessary data related to a given webpage, or “how quickly can you move a complete set of data from the DNS server straight to the client”. The shorter the delay between TTFB and TTLB the better your connection.
The difference between the start time (TTFB) and the end time (TTLB) is, in most cases, rather small, except when dealing with an exceptionally weighty HTML page.
If you want to improve TTLB, caching your static resources on a CDN might somewhat help, but there are only limited ways to improve TTFB/TTLB ratio for much dynamically generated content.
4. Time to Start Render
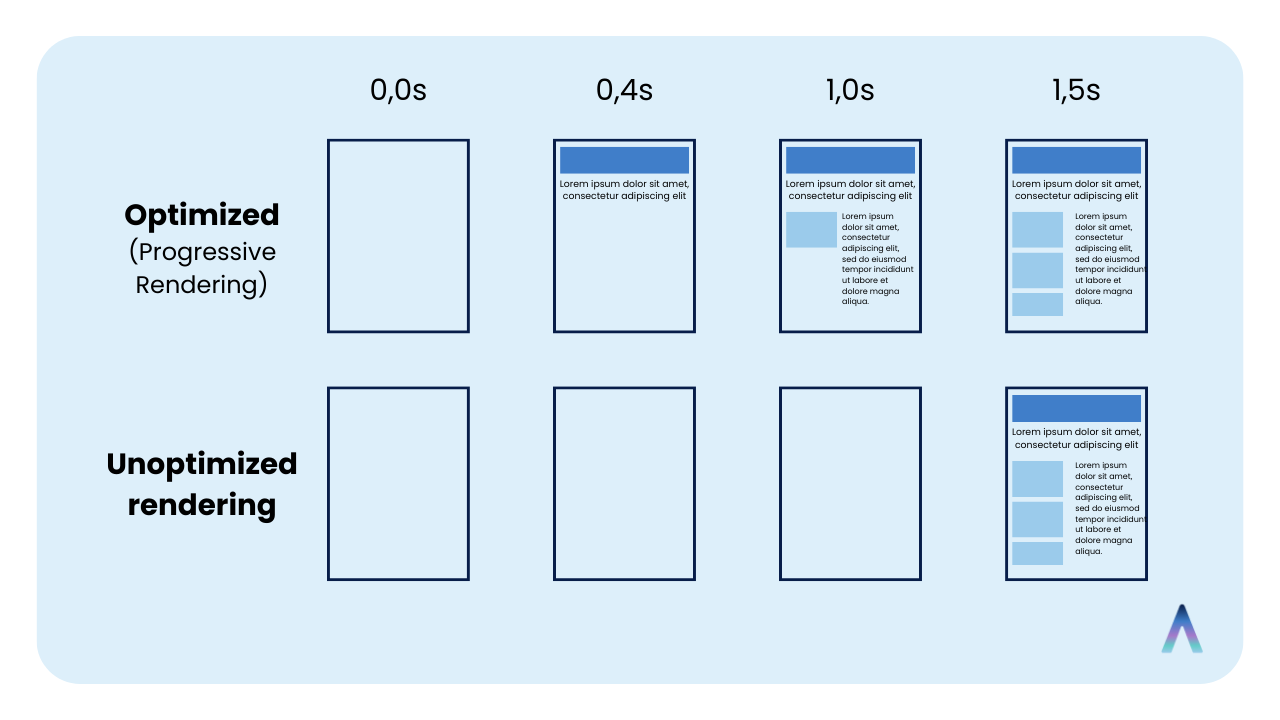
Another important metric that you should know is Start Render Time (SRT), or Time To Start Render (TTSR).
A very similar metric, that some web performance tools also use, is the First Contentful Paint (FCP).
The first two metrics measure the time it takes for the web page to start displaying the first assets to users. Specifically, Start Render Time is the time it takes for the DOM to complete and the window load event. First Contentful Paint (FCP) on the other hand, refers to the amount of time it takes the web page to display actual content that the users came for (i.e., images, text, video, animations, etc.).
The Start Render Time, just like the previous metrics, is composed of different, smaller indicators:
- Time to First Byte (TTFB),
- connect and server response time,
- processing elements in the HEAD of a processed document,
- page rendering and parsing.
According to HTTP archive, currently, the average Loading Speed for desktop computers is 1.9 seconds, while for mobile devices – 3.6 seconds.
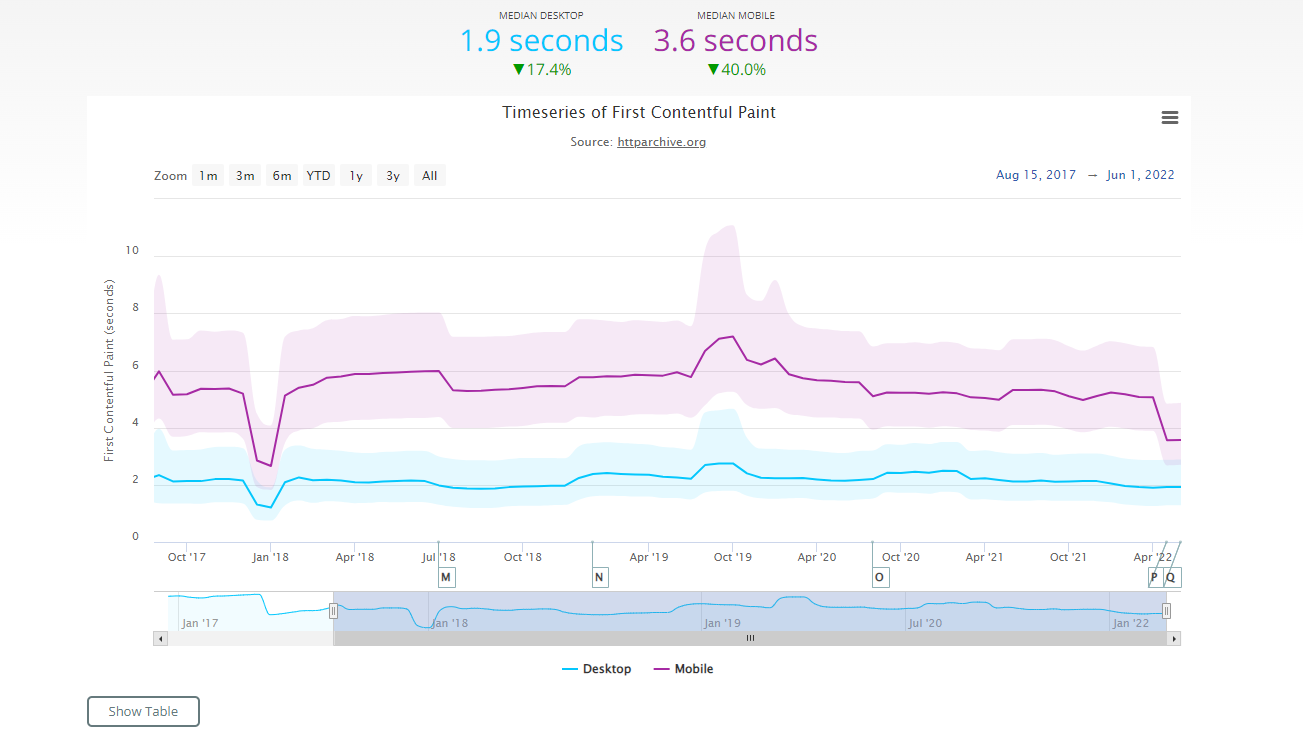
Source: HTTP Archive
A fast SRT time gives users the feeling of responsiveness and improves the overall user experience.
It is also a vital metric to follow as it has a significant influence over the bounce rate, since average users can’t stare at a blank screen for long. With the first assets loading almost immediately, they will know they are on the right page and will not leave it right away.
Web developers thus should make sure that Loading Times do not significantly deviate from the global average and are kept under 1-2 seconds.
5. DNS Lookup Time
One of the main and most basic web performance metrics, which is also a key component of other, more complex ones, is DNS Lookup Time.
A DNS on its own stands for Domain Name System, the main purpose of which is to keep records pertaining to which domain names certain IP addresses belong to. Its core functionality is often compared to a phone book that has listed people’s names along with phone numbers associated with them.
When it comes to the performance metric itself, DNS Lookup Speed is the time it takes for a domain lookup to take place while the needed resources are being loaded by the server. Unnecessary DNS lookups can be responsible for generating a substantial amount of extra load time, especially if an application loads numerous third-party apps and solutions.
The average DNS lookup speed is between 20 and 120 milliseconds, varying depending on the complexity of the site itself. Anything between that and under is generally considered very good.
Have you noticed that your results are considerably worse? Below, we’ve provided 5 most useful tips on improving DNS lookup time:
- Reduce the number of hostnames – Each external request, like social media widgets, libraries, and fonts require a separate DNS lookup. The most basic way of optimizing this part of website performance is to determine whether all of these external resources are really necessary, and if the delay in DNS lookup time is worth it from the business perspective. Each simplification will positively impact loading speed in the long run.
- Cache and host Files Locally – If you’ve already looked through all external request files and determined that all of them are vital to your business, you can now consider downloading some of them and hosting them on your origin server or CDN. Thanks to that, all the necessary resources will be retrieved without having to make an additional DNS lookup.
- Use a Fast DNS Provider – Third-party servers come in all shapes and sizes. Free DNS options are often slow, while premium DNS providers generally have faster response times. It is worth going through the available options and choosing the one that offers the best price-to-performance ratio. To help paint a clearer picture of the different DNS provider markets, you can use this tool to check the top-performing vendors.
- Defer non-essential JavaScript Files – While some third-party JavaScript add-ons create value for the business, their existence in webpage code can hurt load times. You can somewhat limit that by parsing used JavaScript files until users really need them. This tactic won’t reduce the number of DNS lookups required instead, it will delay the loading of non-critical files. This will result in better-perceived website performance.
- Minimize the Number of CNAME Records – CNAME records generate additional DNS lookups, which will significantly hurt page performance. Even though some of them, are necessary, you have to make sure that all the records you currently have are needed and worth the time penalty.
Content characteristics’ performance metrics
We’ve already covered the main performance metrics.
Now, let’s briefly cover the basics of displayed content characteristics, as it also has a major impact on the overall web performance.
6. Hardware utilization
When you make use of external hosting providers, you may be under the impression that hardware utilization is not your responsibility. After all, that’s the main benefit of outsourcing – minimizing the influence of negative factors and risks.
In reality, though, your organization has dedicated CPU threads and memory modules, and therefore keeping tabs on hardware should be a priority, as ineffective architecture using too many resources may seriously hinder the end-user experience.
There are three main components to focus on:
- The CPU performance,
- Disk space,
- RAM Utilization.
7. Overall weight
Over the years and after multiple iterations and changes, your webpage might have gained some weight here and there. Unlike humans who can exercise more or go on a diet, for a webpage to lose weight, an experienced developer must take a closer look at its content.
Page weight refers to the total size of all the resources on a given web page (code files, images, embeds, etc.).
As you might expect, load time is strongly influenced by the page’s overall weight. Simply put, the more files there are, the more work the browser needs to do to render it completely.
It is worth mentioning that more important than the overall weight is the relationship between each asset since one problematic item can slow down other assets as well.
Furthermore, the growth of web page size is usually continuing as the organization expands and modifies its website. It is therefore really important to step back from time to time and see which assets are really needed.
8. Asset weight and count
The number of assets you have obviously affects your website’s overall weight, but it’s important to differentiate between asset count and weight. Every asset, no matter how small or compressed, has the potential to add more time to the loading process.
What you can do to optimize the assets that you have on your web page?
- Don’t go overboard on the number of images,
- Keep files small by limiting image file formats to JPG, PNG or GIF.
- Resize your images to the desired dimensions before uploading them. Leaving the final scaling to the server itself can lead to unnecessary delays that can be easily avoided.
Read also: How to Prepare for Outsourcing Software Development?
User-centric performance metrics
Last but not least, we are going to cover 3 website performance metrics that are directly correlated with user experience. They are part of a Web Vital initiative developed by Google to provide a unified benchmark and quality control when striving towards optimal user experience on the web.
Getting familiar with these important metrics is especially important since they are being measured by the real user monitoring tools like Google Analytics.
9. Largest Contentful Paint (LCP)
An important metric that is similar to Time to Start Render which falls into the Core Web Vitals is Largest Contentful Paint (LCP).
Largest Contentful Paint (LCP) is a vital and more user-centric metric for measuring page load speed because it looks for the point when the website loads the main part of the designed content.
Documentation for API designed to operate this metric characterizes the main types of elements considered as Largest Contentful Paint:
- <img> and <video> elements,
- <image> elements inside an <svg> element
- An element with a background image provided by the url() function
- Block-level elements consisting of text nodes or inline-level text elements of other types.
Largest Contentful Paint (LCP) is considered to be more useful from the UX standpoint as it focuses on perceived performance.
Other performance metrics like Time to Start Render (TSR) only capture the very beginning of the loading experience which, in a lot of cases, can be represented as a splash screen or a simple loading indicator.
This moment quite irrelevant from a user perspective, and the longer one has to wait for the content, the more frustrated they will become.
To ensure good user satisfaction, website admins should strive to have Largest Contentful Paint metric of 2.5 seconds or less.
A good threshold to measure is the 75th percentile of page loads, segmented across mobile and desktop devices.
10. First Input Delay (FID)
According to psychology experts, within the first seven seconds of a meeting, people will have a solid first impression of you as a person. When it comes to online experiences, it takes much less time.
If a page takes too long to answer users’ inputs, it will very quickly discourage a huge number of potential customers. That’s why it is crucial for you to make sure that the First Input Delay metric isn’t hurting your website’s performance.
FID measures the time from when a site visitor first interacts with a page to the time when the browser is actually able to begin processing event handlers. The longest delays typically occur between First Contentful Paint (FCP) and Time to Interactive (TTI) because the website has already rendered some of its elements but isn’t yet completely interactive.
In order to optimize user experience, website admins should minimize their First Input Delay to 100 milliseconds or less.
11. Cumulative Layout Shift (CLS)
This situation must have happened to you at some point – you are browsing some web pages and as soon as you want to click a button, the layout suddenly shifts, and it takes you to somewhere else.
Without a doubt, there are only a few as irritating things as this online (apart from unskippable YouTube ads). To save your users from experiencing the same thing, you should look into the Cumulative Layout Shift metric.
CLS is a measure of the largest burst of layout shift in the page loading process. A layout shift takes place when the already rendered element of a site changes its position during the loading process.
In order to calculate the value of this metric, the browser looks at the viewport size and the movement of unstable elements in the viewport between two rendered frames. The CLS score consists of two measures:
- impact fraction – is the measurement of instability of elements in the viewport area between two consecutive frames,
- distance fraction – is the largest distance any unstable element of the website has moved from one frame to another divided by the viewport’s largest dimension.
To optimize a website’s performance from the perspective of user experience, the CLS score should be no more than 0.1.
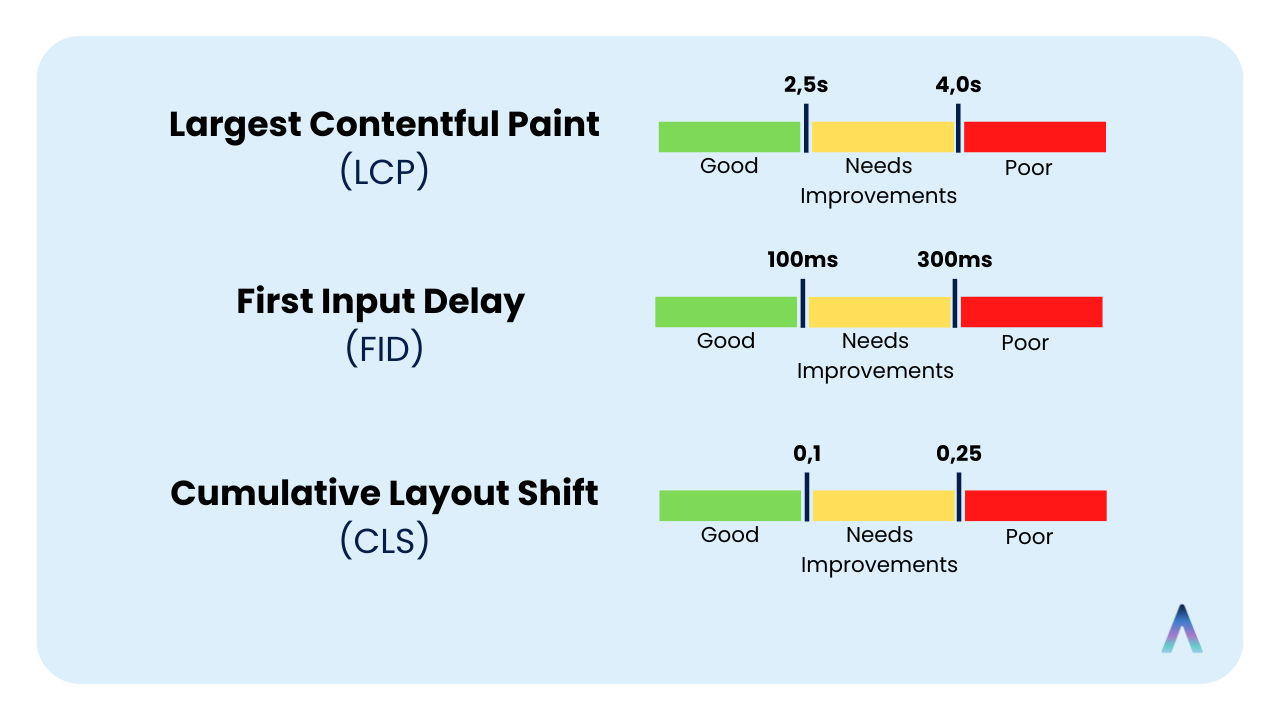
Source: Web.dev
What metrics are important to your SaaS website performance
For Software as a Service (SaaS) applications, web performance is probably even more important than for an average company’s landing page.
A SaaS company delivers applications over the Internet in a form of service. Instead of installing software, users can simply access it via the Internet, freeing themselves from complex software and hardware management.
Straight from this definition, we see that the SaaS application performance metrics are even more important because usually, they offer orders of magnitude more functionalities for its users.
SaaS admins and developers should especially take a closer look at hardware utilization metrics, as SaaS architecture might have a profound influence on future expansion opportunities.
Ecommerce website performance metrics
As we’ve already mentioned right at the beginning, Google recommends page load time of under two seconds.
Two seconds is the threshold for e-commerce website acceptability, while Google aims to keep load time under a half-second.
Webpage speed in e-commerce is extremely important as it influences conversion rates, SEO performance as well as outcomes of combined marketing efforts.
2020 Google research shows that a mere 0.1-second improvement of mobile site speed can lead to 8.4% increase in conversion rate as well as 9.1% more shoppers adding items to their baskets.
To learn more about e-commerce performance check our in-depth article about most important e-commerce metrics.
Website performance metrics – summary
Website performance has undoubtedly become one of the top priorities of web admins when it comes to improving conversion rates and optimizing user experience. There are a lot of factors influencing how fast a given website loads and how users perceive this whole process. All software developers and web admins should thus be familiar with the performance metrics described in this article in order to have a better understanding of the inner workings of websites and their influence on the experience of end-users.
Related Posts
- What Is Hazelcast And What Is It Used For?
- How to Achieve Fast Web Application Performance: 10 Practical Tips for Developers
- Ultimate Guide To Java Performance Monitoring: Which Java Profiler Is The Best?
- Web Application Development: Your Must-Have Guide for 2024
- Software Application Development Guide: Types of Applications and Development Methodologies
We are Stratoflow, a custom software development company. We firmly believe that software craftsmanship, collaboration and effective communication is key in delivering complex software projects. This allows us to build advanced high-performance Java applications capable of processing vast amounts of data in a short time. We also provide our clients with an option to outsource and hire Java developers to extend their teams with experienced professionals. As a result, the solutions designed for our customers contribute to their business development. We specialize in travel software, ecommerce software, and fintech software development. In addition, we are taking low-code to a new level with our Open-Source Low-Code Platform.