
What is GIS: a Complete Guide to Geographic Information Systems
Let’s talk today about an essential tool for those working with spatial data. GIS technology has revolutionized the way we collect, analyze, and present information about the world around us. In this blog post, we will provide an in-depth introduction to GIS, covering everything from what it is to how it works, what kind of data it captures, and what GIS mapping is. We will also provide real-world examples of how GIS is used in a variety of industries.
What is GIS?
GIS is a computer system that allows users to capture, manipulate analyze, and design special and geographic data. GIS stands for Geographic Information Systems, where:
- Geographic refers to the physical location or position on the Earth’s surface.
- Information refers to the data and details that can be used to represent and provide a better understanding of a specific location.
- Systems refer to a tool that makes many components work together to achieve a common goal. It helps us understand the data in a geographic context, which enables to make better-informed decisions in a variety of fields such as urban planning, environmental management, and public health, among others that we will mention later.
To put it differently, GIS combines geographic data (such as maps, satellite imagery, and geospatial databases) with other types of data (such as demographic, economic, and environmental data) to provide insights into various phenomena and patterns.
GIS plays an important role in the global marketplace – after all, it is used by most industries. According to Data Bridge Market Research, Geographic information system market was valued at USD 9160.02 million in 2021 and is expected to reach USD 22518.38 million by 2029, registering a CAGR of 11.90% during the forecast period of 2022-2029.
How does a GIS work?
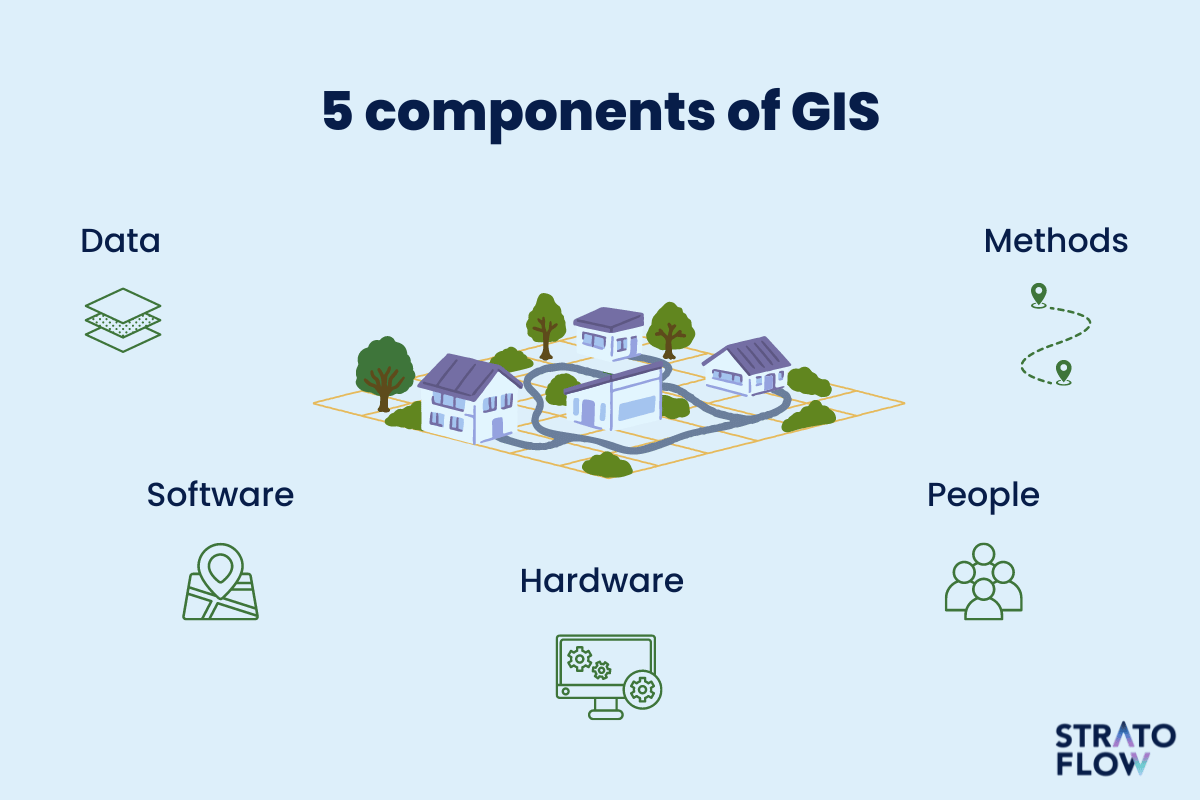
GIS works by integrating five key components: hardware, software, data, methods, and people to capture, store, analyze, and visualize geographic information.
Later in this article, you’ll find a detailed overview of these components, but for now, let’s focus on the most important steps of any geographic information system.
Data acquisition
GIS data can be any data collected from various sources, such as GPS devices, remote sensing technology, and surveys. The data is usually in the form of maps, satellite images, and other geographic data.
Data management
GIS data is stored in a database or file system where it can be organized, maintained, and updated. The data can be edited, filtered, and manipulated to suit the needs of the user.
Data analysis
GIS software provides tools for analyzing and interpreting the data, such as spatial queries, map overlays, and 3D modeling. This helps users to identify patterns, trends, and relationships in the data.
Data visualization
GIS software also provides tools for visualizing the data in various formats, such as maps, charts, and graphs.
Decision making
The information and insight gained from GIS analysis and visualization can be used to support decision-making in a variety of areas, including urban planning, environmental management, and emergency response.
GIS components
GIS is not just a map-making software, it’s much more. As we have already mentioned, GIS consists of five main components.
1. Data
Spatial data
Spatial data is a fundamental element of GIS.
It refers to any type of data that has a geographic or location component. This can include data such as maps, satellite imagery, aerial imagery, GPS data, and geographic survey information. Spatial data can be represented in a variety of ways and used to create different types of spatial analysis and visualization.
The terms spatial data and geoinformation are often used interchangeably, but there is a significant difference. While spatial data provides information about the spatial relationships between objects or phenomena, geoinformation combines spatial data with other types of data to provide a more comprehensive understanding of the world around us. It includes both quantitative and qualitative data, which can be analyzed and visualized using GIS tools and software.
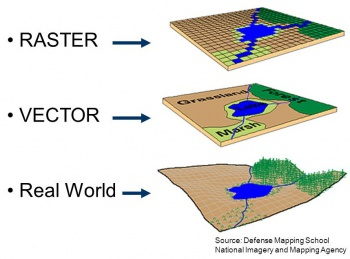
In Geographic Information Systems, spatial data is typically stored in a format that allows it to be integrated with other data types and analyzed using specialized tools and software. There are three spatial data model types: vector data, raster data and tabular data, also known as attribute data.
Vector data
Vector data is the most common type of data loaded into a GIS software and represents data in the form of:
Points
Point data represents geographic features as individual points on a map, such as buildings, trees, or others. Each point is defined by a pair of coordinates, typically latitude and longitude, which specify its location on the earth’s surface.
Lines
Line data is used to represent spatial features, such as roads, rivers, railways, and other linear features. For example, line data can be used to find the shortest route between two points on a map, or to analyze traffic patterns along a particular road or highway.
Polygons
Geographic features that are represented as enclosed shapes or areas on a map. Polygons are used to represent attributes in geographical information system such as land use, parcels, administrative boundaries, lakes, or forests.
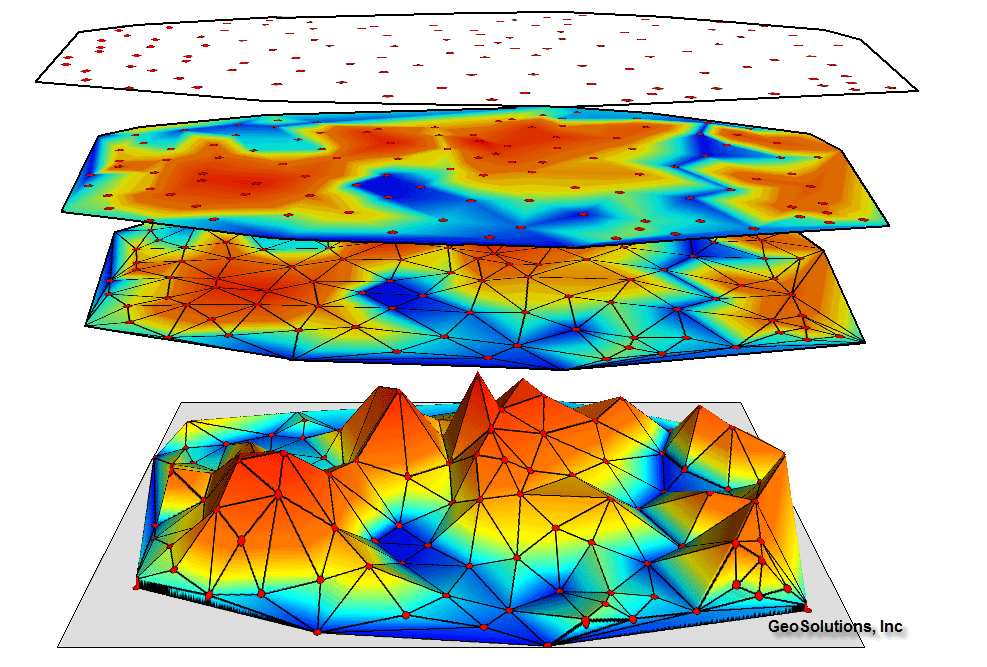
Triangular irregular network (TIN)
This data allows the creation of complex surfaces that accurately represent the terrain of an area. They can be used for a variety of applications, such as modeling water flow, determining the slope of a surface, and analyzing a viewshed.
Raster data
Raster data, or grid data or surface data, represents the landscape as a rectangular matrix of square cells and pixels. Each pixel in a raster represents a small area of the earth’s surface and can contain a variety of attribute information such as height, temperature, or color.
There are three types of raster data: thematic data, spectral data, and pictures.
Raster data can be used in a variety of GIS applications, such as terrain analysis, environmental modeling, and land use planning. For example, raster data can be used to create a digital elevation model (DEM) of a region, which can be used to analyze the slope and aspect of the terrain. Raster data can also be used to create maps of temperature or precipitation across a region.
Tabular data (attribute data)
Tabular data, or attribute table data, are held and manipulated in relational databases. It is used to describe the characteristics of geographic features. Each row in a table represents a geographic feature, and each column represents a specific attribute or characteristic of that feature. For example, a table of cities might have columns for city name, population, elevation, and latitude/longitude coordinates.
Tabular data can be used in a variety of GIS applications, such as demographic analysis, land use planning, and resource management.
To learn what are the most common types of GIS files, check out our List of GIS file formats.
2. Software
All GIS require a software that collect, analyze, store, manage and visualize spatial and attribute data together.
Geographic Information System software is used in a wide range of applications, such as urban planning, natural resource management, emergency management, and transportation planning.
GIS software typically provides a user interface that allows users to load and display geographic data, perform spatial analyses, and create maps and other visualizations. Some GIS software may also include specialized tools for specific applications, such as flood mapping or wildlife habitat analysis.
There are many GIS software packages available on the marker, ranging from open-source software such as QGIS and GRASS GIS to commercial software such as ArcGIS and MapInfo.
3. Hardware
GIS software runs on hardware to manipulate geographic data. Some examples of hardware commonly used in GIS applications include:
- Desktop computers or workstations – the most common type of hardware used in GIS, and typically include a central processing unit (CPU), memory (RAM), storage (hard drive or solid-state drive), and a graphics processing unit (GPU) to display maps and visualizations.
- Input devices – used to capture geographic data, including digitizers, scanners, GPS devices, and other sensors.
- Output devices – used to display and share their work, such as printers, plotters, projectors, and monitors.
- Servers – used to store data and serve from dedicated server hardware, allowing multiple users to access and manipulate the data simultaneously.
- Mobile devices – such as smartphones and tablets are increasingly being used for GIS applications, particularly in fieldwork and data collection. These devices often have built-in GPS sensors and cameras for capturing geolocated data.
4. Methods
Some common GIS methods include:
Spatial analysis
According to the U.S. National Research Council, spatial analysis involves using GIS tools to analyze geographic data and derive insights about various phenomena, such as disease outbreaks, traffic patterns, and natural resource distribution.
Cartography
The science and art of creating maps, which involves designing and presenting geographic data in a visually appealing and informative way.
Remote sensing
Remote sensing is the process of gathering information about the Earth’s surface using sensors that are not in direct contact with the surface. This can include aerial photography, satellite imagery, and other forms of data collection. Remote sensing data is typically used in GIS applications to create maps, analyze land use patterns, and monitor environmental changes over time.
Geostatistics
A set of statistical techniques used to analyze geospatial data, such as interpolation, clustering, and regression analysis.
Network analysis
A set of techniques used to analyze transportation and utility networks, such as routing, shortest path analysis, and service area analysis.
Data visualization
The process of using charts, graphs, and other visual aids to communicate information and insights derived from GIS data.
Data management
The process of collecting, storing, and maintaining geographic data within a GIS, including tasks such as data cleaning, organization, and metadata creation.
3D modeling
The creation of three-dimensional representations of geographical data, which can be used for visualization, simulation, and analysis purposes.
5. People
GIS professionals play a crucial role in the successful implementation and use of GIS technology. They are responsible for designing and implementing GIS projects, collecting and managing spatial data, performing spatial analysis, creating maps and other visualizations, and communicating the results of their work to a variety of stakeholders.
GIS is applied in many industries what means that GIS specialists may work in a variety of fields, including government, environmental management, urban planning, transportation, public health, and many others. They may also work for private consulting firms or as independent contractors.
Some of the common roles within GIS include:
- GIS Analyst: responsible for managing, analyzing and visualizing spatial data. They use GIS software to create maps, perform spatial analysis, and develop geographic models to solve problems in various fields.
- GIS Technician: assists the GIS analyst in data collection, input, and management, and helps in creating maps and visualizations.
- GIS Developer/Programmer: creates software applications and tools that use GIS technology, including web-based mapping applications and mobile GIS applications.
- Cartographer: responsible for creating maps that are accurate, clear, and visually appealing, by combining data and design principles.
- Urban/Regional Planner: uses GIS to analyze and evaluate land use, population growth, and transportation.
- GIS Project Manager: takes care of the planning, coordination, and execution of GIS projects, including project management, budgeting, and team management.
- GIS Consultant: provides expert advice and guidance to clients on GIS-related issues, including data management, analysis, and visualization.
- Remote Sensing Analyst: does analysis and interpretation of satellite or aerial imagery using GIS software to extract information about the Earth’s surface.
- Surveyor: collects and measures data about the Earth’s surface, including the use of GPS technology and the creation of maps and surveys.
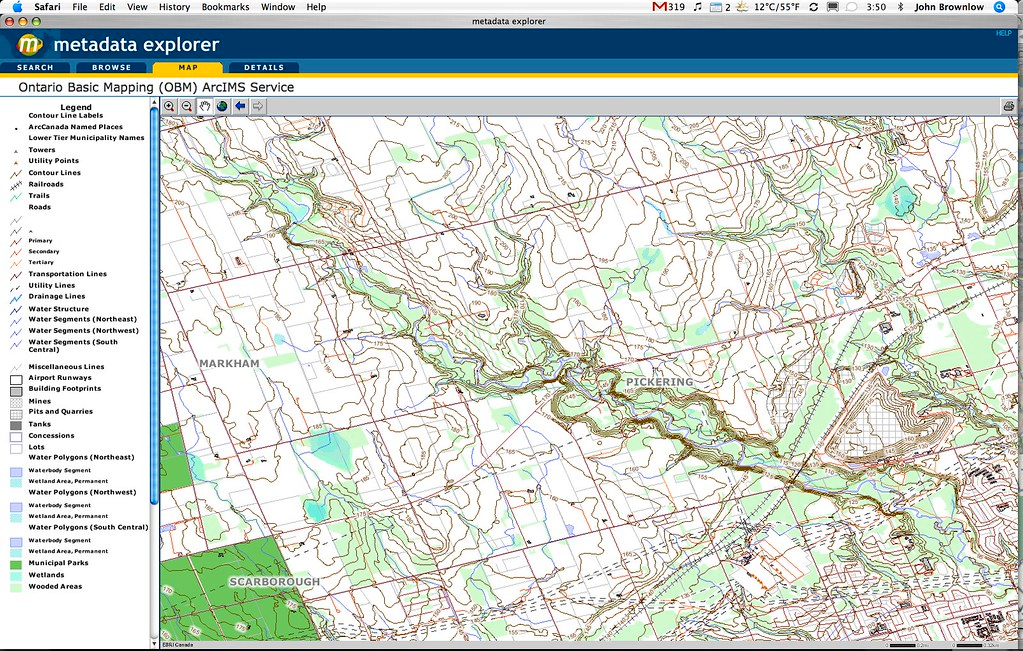
What are GIS maps?
Geographic information system maps are digital maps that use geographic data and spatial analysis, that have been processed and analyzed using GIS software, to display and analyze information about the Earth’s surface. Unlike traditional, tabular maps, GIS maps are dynamic and interactive.
There are various types of GIS maps, including: category maps, heat maps, cluster maps, bubble maps, quantity maps.
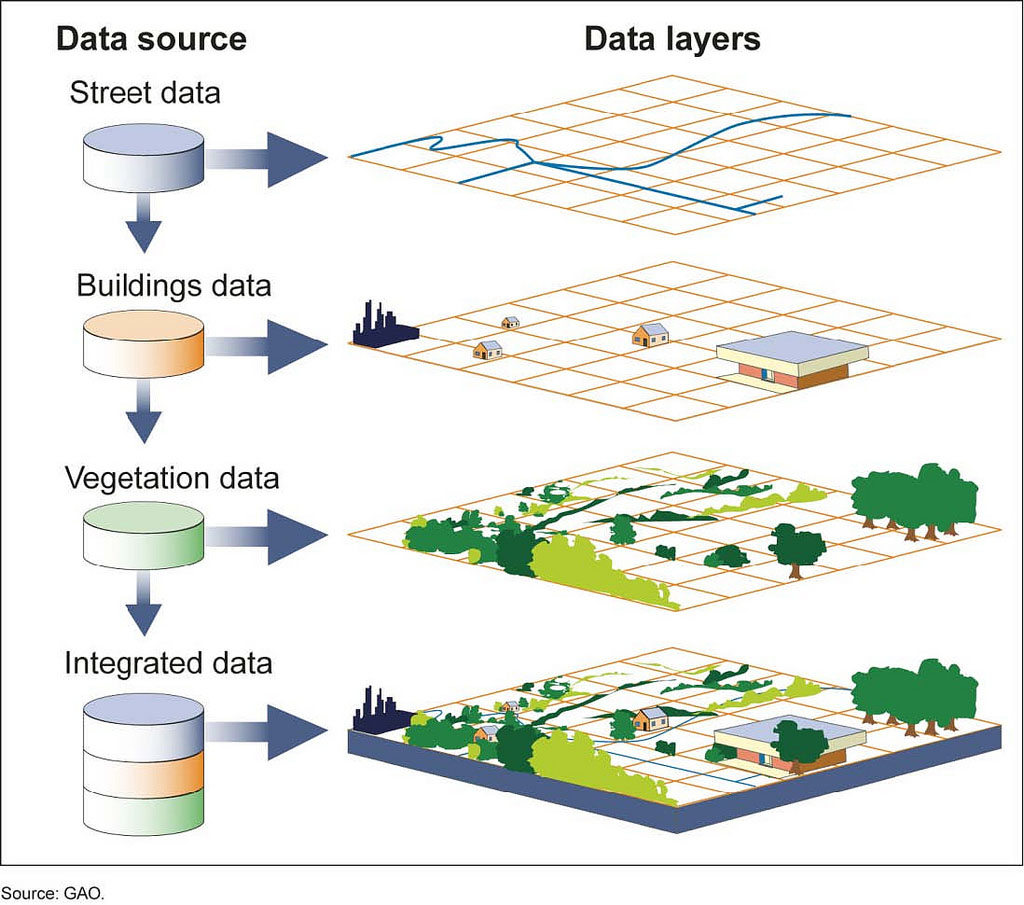
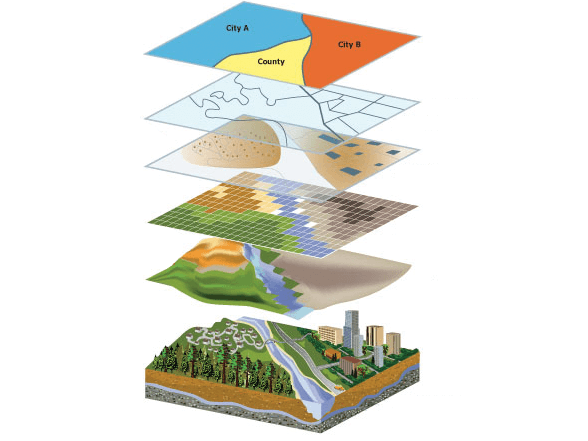
One of the fundamental elements of any GIS is the map layers. Each layer represents a different aspect of the geographic data being analyzed and data layers can be turned on or off to display only the relevant information for a particular analysis or map.
[Read also: The best alternatives to Google Maps]
What is a difference between GIS and GPS?
GIS (Geographic Information System) and GPS (Global Positioning System) are two distinct technologies used in the field of geospatial data management, but they serve different purposes.
GPS is a satellite-based navigation system that enables users to determine their exact location on the Earth’s surface. It uses a network of satellites and GPS receivers to provide accurate location information in real-time.
On the other hand, GIS is a system that allows users to store, manage, analyze, and visualize geographic data, as mentioned earlier. It combines various data sources, such as maps, aerial photographs, and satellite images, to create detailed spatial databases that can be used to answer complex questions about the environment, demographics, and infrastructure.
While GPS provides location information, GIS provides a framework for organizing and analyzing location-based data. Geographic information systems can incorporate GPS data, but it can also use other sources of geographic information.
In short, GPS is a tool for acquiring location data, while GIS is a system for managing and analyzing that data to gain insights into spatial relationships and patterns.
What is GIS used for?
GIS works on many levels and is used in most of industries and organizations for various purposes.
In general, GIS is a versatile tool that can aid in problem solving, decision making, and data visualization in a spatial context by analyzing and intepretating geospatial data.
How is GIS used?
The GIS process typically begins with defining the problem that needs to be solved. This could be anything from identifying the best location for a new facility to analyzing the impact of a new development on the environment.
Once the problem is identified, the criteria for the GIS analysis need to be defined. This could include factors such as geographic location, distance, and land use.
Next, the necessary datasets need to be imported or built. This could include data such as satellite imagery, demographic data, or topographic maps.
The datasets are then analyzed using layers, which are the individual pieces of data that make up such a map together. By analyzing the layers together, it is possible to gain insights into the problem at hand. For example, by analyzing the layers, it is possible to determine the location of features, the density of features in a particular space, and the relationships between features.
The output of the GIS analysis could be a map, a report, or other visual representation of the data. This output will help to communicate the results of the analysis to others.
Finally, based on the output of the GIS analysis, a decision can be made to solve the problem at hand. For example, if the analysis shows that a proposed development would have a negative impact on the environment, the decision could be made to locate the development elsewhere.
Who uses GIS?
GIS is used in organizations across many industries. The higher usage of GIS technology is nowadays in public sector with government and military applications accounting. According to Zion Market Research, this segment accounts for 28% share of the GIS market.
Other industries and sectors that use GIS are:
Business:
- Banking technology and financial services
- Insurance
- Media and Press
- Real Estate
- Retail
Education:
- Libraries and museums
- Schools
- Universites
Government:
- Architecture, engineering, construction
- Economic development
- Electrions
- Land administration
- Public Works
- Surveying
- Urban planning
Health services:
- Public Health
- Hospitals
- Academic programs and research
Mapping and charting:
- Cartographic
- Topographic
- Nautical
Natural resources:
- Agriculture
- Climate change
- Conservation
- Mining
- Water resources
Public Safety:
- Emergency and disaster management
- Wildland fire management
- Criminality
Transportation
- Aviation
- Highways
- Logistics
- Public transport
Based on Introduction to GIS video.
Real-world examples of use of GIS
Disaster response
During Hurricane Harvey in 2017, GIS was used to map the affected areas and identify locations of stranded individuals. The GIS data was then used to coordinate rescue efforts and allocate resources to those in need.
Wildlife conservation
In South Africa, GIS is used to track the movements of endangered species such as rhinoceroses and elephants, helping to prevent poaching and protect wildlife populations.
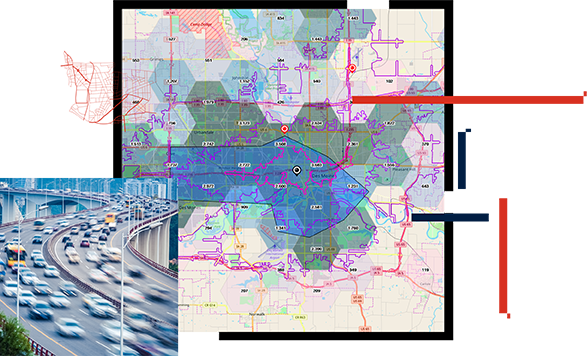
Transportation planning
In cities, GIS is used to analyze traffic patterns and optimize bus routes, helping to improve public transportation and reduce traffic congestion.
Pandemic
GIS has been used to create real-time maps that show the spread of the coronavirus at the local, national, and global levels. These maps have been used to track the number of cases, deaths, and recoveries, and to identify areas where the virus is spreading more rapidly.
GIS has also been used to support contact tracing efforts. GIS has been used to create maps that show the locations where infected individuals have been, which can help to identify potential contacts who may have been exposed to the virus.
Renewable energy
GIS is used to identify areas with high potential for solar and wind energy production, helping to guide investment in renewable energy infrastructure.
Summary
GIS is a powerful tool for those working with spatial data. It allows us to capture, store, analyze, and present information about the world in new and innovative ways. By leveraging GIS mapping, we can create detailed visualizations of everything from traffic patterns to natural resource management. With real-world examples of how GIS is used across industries, this blog post serves as a comprehensive introduction to the world of GIS.
If you’re in need of GIS solutions, we specialize in creating custom software that fits your specific needs. We can discuss the details with you to find the best solution for your business. Contact us today for more information!
Related Posts
- 10 Best Custom Insurance Software Development Companies in 2026
- How to Build an Inventory Management System: Key Steps and Tips
- How to Build a Document Management System: Alternative Approach
- Online Shopping Recommendations – Introducing Them to Your Business
- Amazon Product Recommendation System: How Does Amazon Algorithm Work?
Thank you for taking the time to read our blog post!